Hi,
I got a chance to learn ChartJS and Google Visualization. Both are basically for preparing charts using data, so user can feel more better with their data. How things are going point by point.
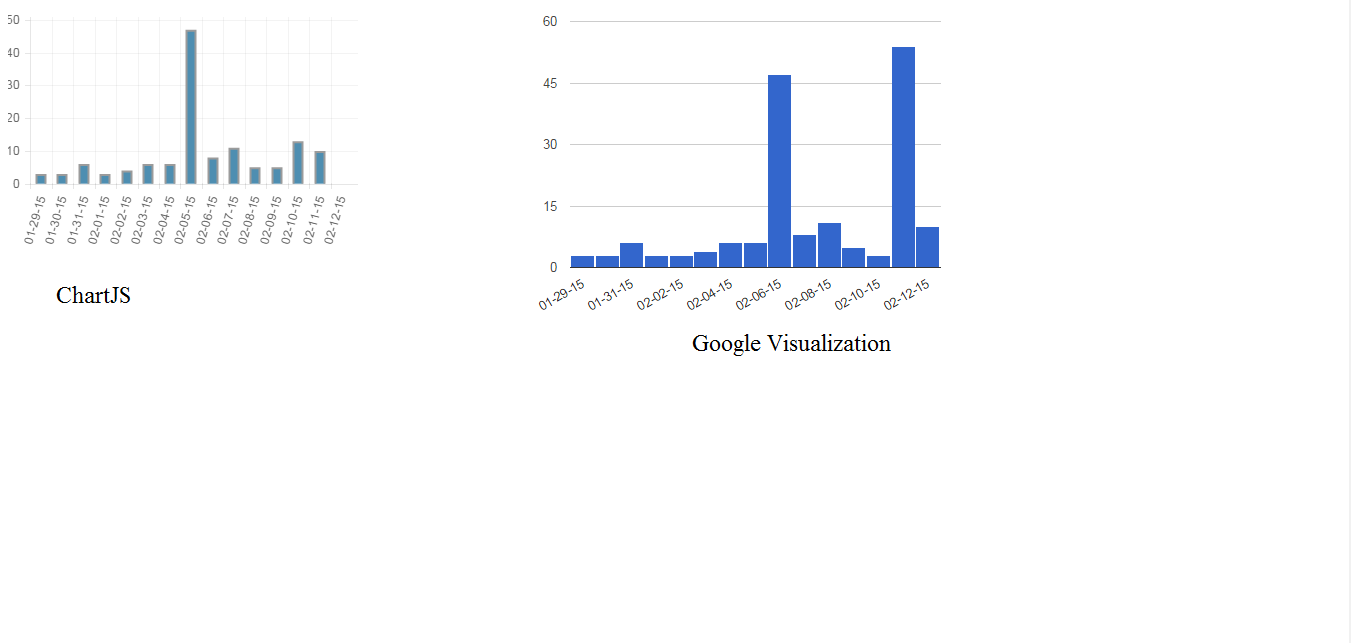
ChartJS
It have 6 types of different Chart, we can build charts directly. Documentation is also very handy, very easy to understand.
Documentation: http://chartjs.org/docs/
For linking: <script type="text/javascript" src="http://chartjs.org/assets/Chart.js"></script>
I have a fiddle to show
http://jsfiddle.net/ramakrishnap/0Lfzx74v/
Google Visualization(Google Charts)
In this there are many kinds of Charts,Graphs it also have pagination techniques. Understanding documentation takes time, implementation needs much care. It is rich with UI and functions.
Documentation: http://developers.google.com/chart/interactive/docs/reference
For linking: <script type="text/javascript" src="https://google.com/jsapi"></script>
I have a fiddle to show
http://jsfiddle.net/ramakrishnap/4gtLc9ss/
I got a chance to learn ChartJS and Google Visualization. Both are basically for preparing charts using data, so user can feel more better with their data. How things are going point by point.
ChartJS
It have 6 types of different Chart, we can build charts directly. Documentation is also very handy, very easy to understand.
Documentation: http://chartjs.org/docs/
For linking: <script type="text/javascript" src="http://chartjs.org/assets/Chart.js"></script>
I have a fiddle to show
http://jsfiddle.net/ramakrishnap/0Lfzx74v/
Google Visualization(Google Charts)
In this there are many kinds of Charts,Graphs it also have pagination techniques. Understanding documentation takes time, implementation needs much care. It is rich with UI and functions.
Documentation: http://developers.google.com/chart/interactive/docs/reference
For linking: <script type="text/javascript" src="https://google.com/jsapi"></script>
I have a fiddle to show
http://jsfiddle.net/ramakrishnap/4gtLc9ss/
No comments:
Post a Comment